Heikin Ashi trading: all pros and cons of the indicator
Heikin Ashi (or sometime they call it Heiken Ashi) can be translated from Japanese as the “average pace”. The name and the table speak for themselves: Heikin Ashi is sort of an indicator that makes the price chart to look smoother.
If you have ever tried to backtest the standard candlestick patterns then you definitely noticed a great deal of reversal signals that did not lead anywhere. It is a common thing to find several “hammers” or “outside bars” during the downtrend. However, if you keep acting on every single signal like this you will end up with tons of open and very soon closed trades, while the trend is just moving down and making some occasional retracements.
A good strategy requires not to follow every signal but to skip most of those signals with the help of some additional method.
Heikin Ashi chart calculations
| Price | Candlestick | Formula |
| Open | Previous candle | (Open + Close)/2 |
| High | Current candle | The highest point |
| Low | Current candle | The lowest point |
| Close | Previous candle | (Open + High + Low + Close)/4 |
How to install the Heiken Ashi indicator on your chart:
- Open your Forex Tester.
- Click on “Insert” option at the top of the window.
- Select “Add indicator".
- Choose “Heiken Ashi”.
- Change the colors of the up and down candlesticks (or just leave the default red-blue scheme).
- Set the time frame that fits your trading system.
Types of candlesticks:
- Green candlesticks with long bodies – uptrend.
- Red candlesticks with long bodies - downtrend
- Small body surrounded by upper and lower shadows – trend is going to change
- Green candlesticks with no lower shadows – strong uptrend
- Red candlesticks with no upper shadows – strong downtrend
Heiken Ashi trading system
- Detect the trend with the help of any other indicator (a Moving averages with a quite long period will work fine) or trend lines.
- Consider opening the trade in the trend directions only.
- 2.1 If there is an uptrend – open either a long position or do nothing.
- 2.2 If the downtrend occurs then open short positions only.
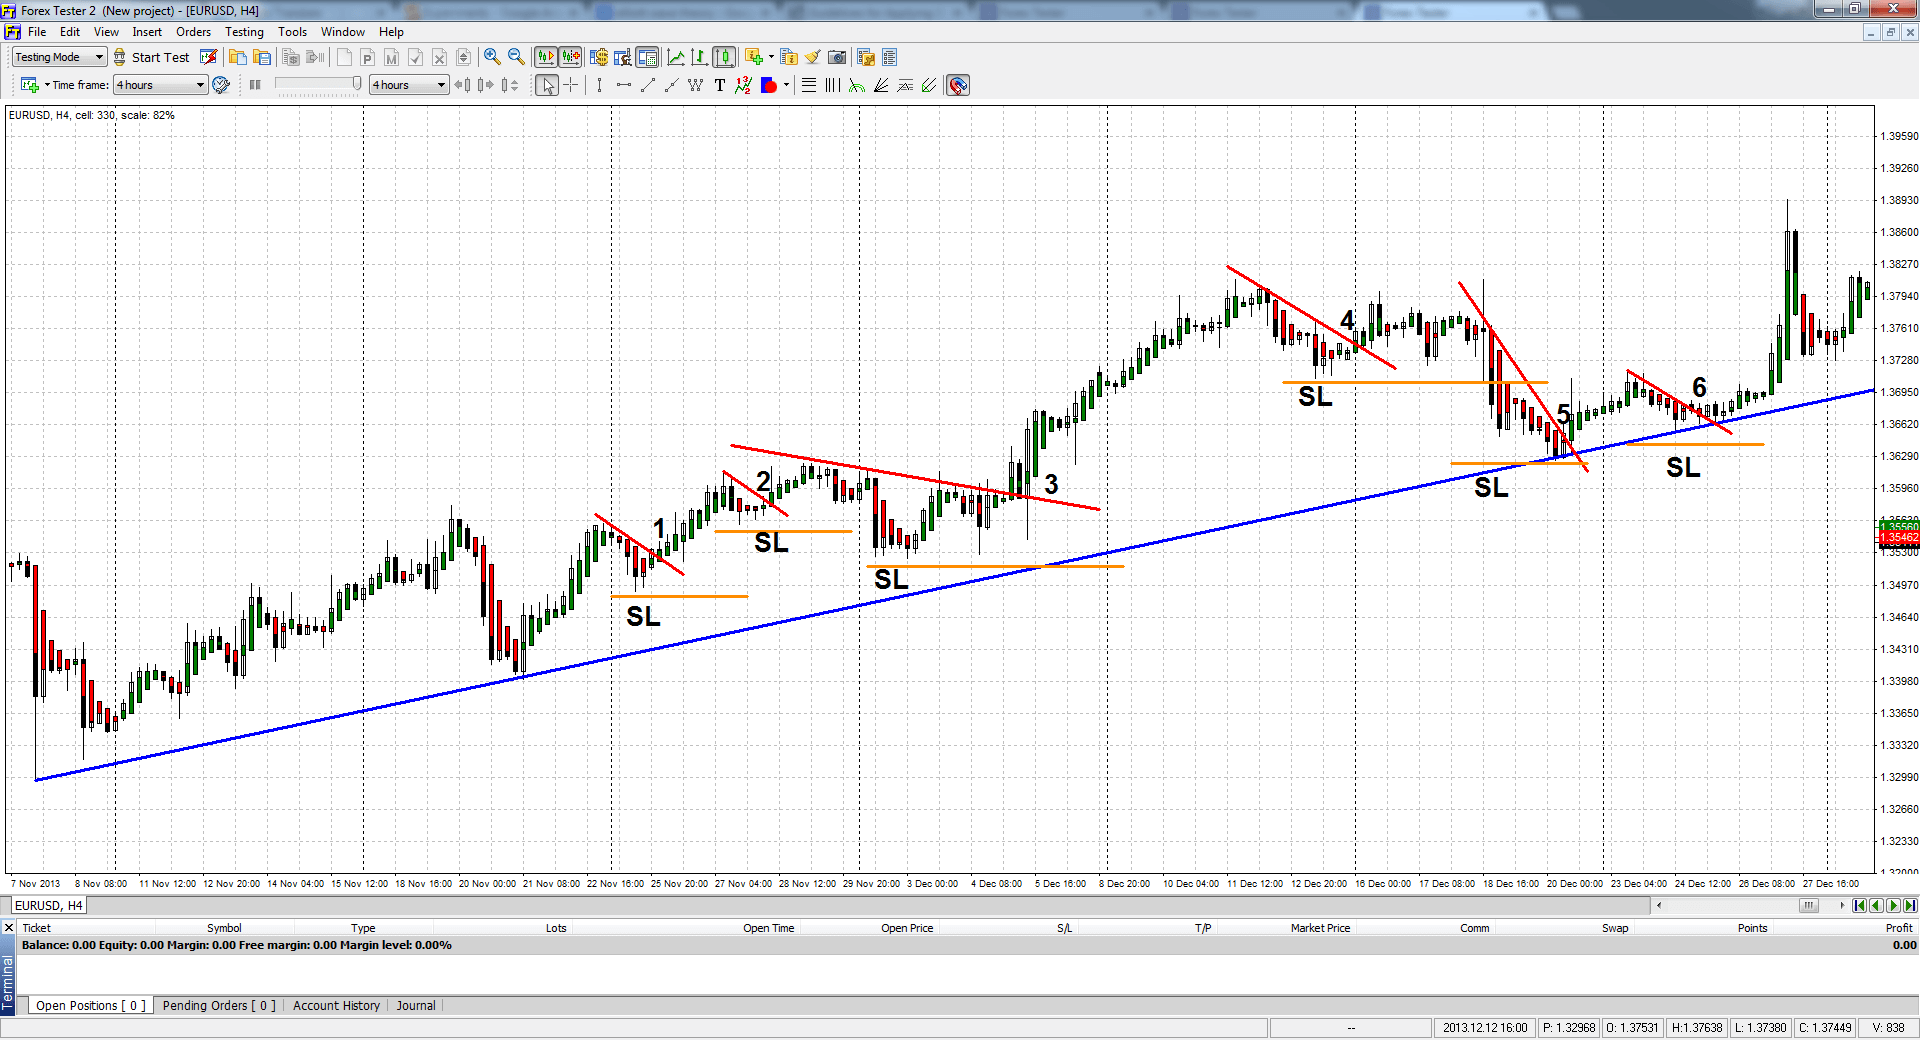
- Draw a trend line for a current countertrend movement (all oblique red lines on the chart).
- Set a stop order (the digits from 1 to 5 on the Heikin Ashi chart):
- 4.1. Buy stop order should be placed a few pips higher than the trend line on uptrends.
- 4.2. Sell stop order should be placed a few pips lower than the trend line on downtrends.
- Place a stop loss (dark orange lines on the chart):
- 5.1. A few pips lower than the previous low on the bullish trends.
- 5.2. A few pips higher than the previous high on the bearish trends.
- Take profit (2 options)
- 6.1 A pre-defined amount of pips that correlates with the amount of stop loss. For example, you can have a 1:1, 1:2 or 1:3 ratio depending on your trading style. Thus, if stop loss equals 35 pips then take profit would be 35, 70 or 105 correspondingly.
- 6.2 Exit the trade manually when you notice the first bar of the opposite color. On the Heikin Ashi chart, you can see that all bullish candlesticks are of the green color and all bearish ones – of the red color. That is why a trader can exit the long trade with a profit every time he (she) sees a red candlestick.
Good things about Heikin Ashi:
- There is no need to think about the period as it usually happens with most of the indicators. Traders often become obsessed about which parameters to select for Stochastic, MACD, Moving Averages and many others. With Heikin Ashi you can set the colors of the candles only.
- Heiken Ashi indicator compared to the regular price chart slows down the speed of the market, eliminating unnecessary false signals.
- It makes many false signals and retracements disappear leaving you with rock solid calls to action.
- Detects a strong trend that allows you to stay in the trade without being nervous or making any unnecessary moves.
Bad things about the Heikin Ashi chart:
- Every indicator that is based on slowing down the signals does its best on trends only. Heiken Ashi smoothed signals do not let you to notice the reversal in time. Any Heiken Ashi strategy should take into consideration that lagging indicators not only dismiss useless signals to open the trade but also provide you with a late signal for closing the trade. That is why you will often see the market slowly destroying your profit and later on, you will understand that the trend has already changed.
- This indicator does not fit short-term and scalping strategies.