Get more of Forex trading simulator: 6 chart modes for deeper Forex learning
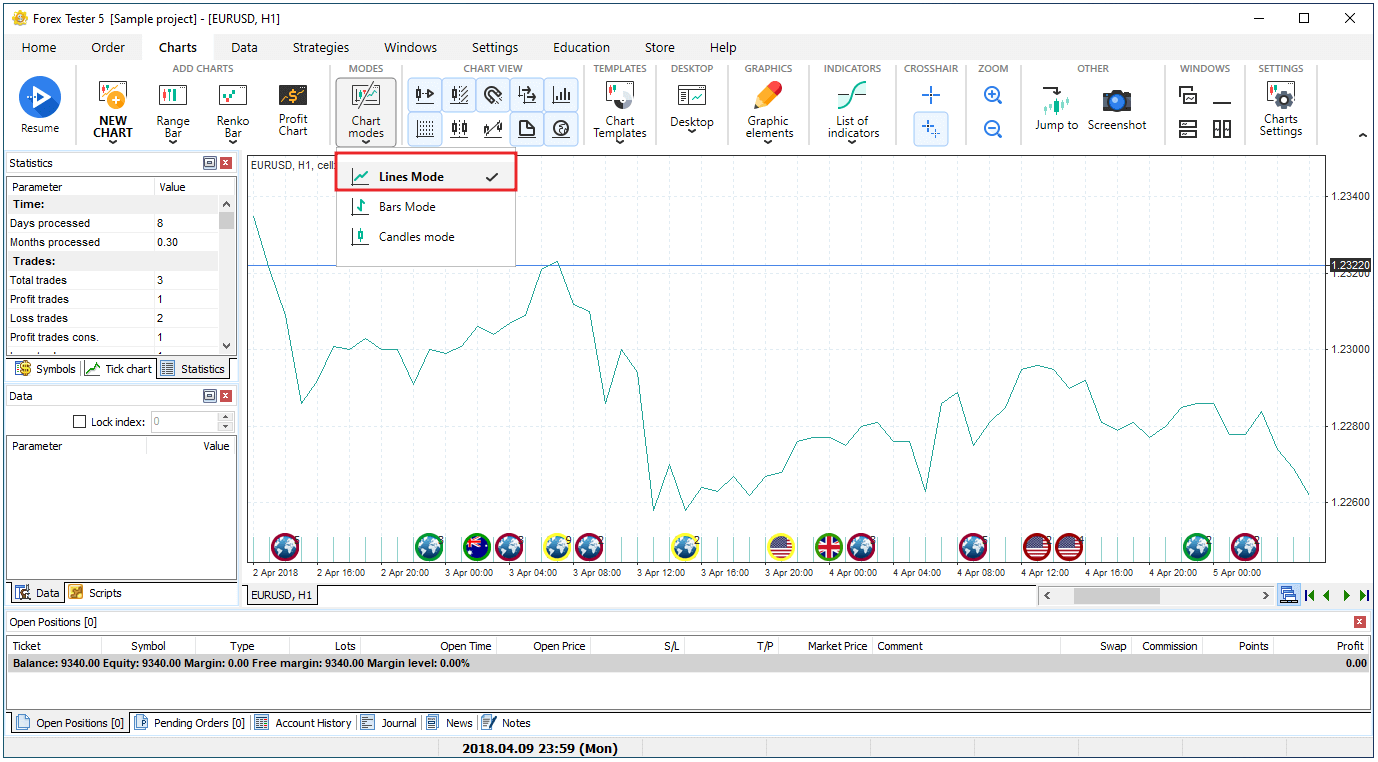
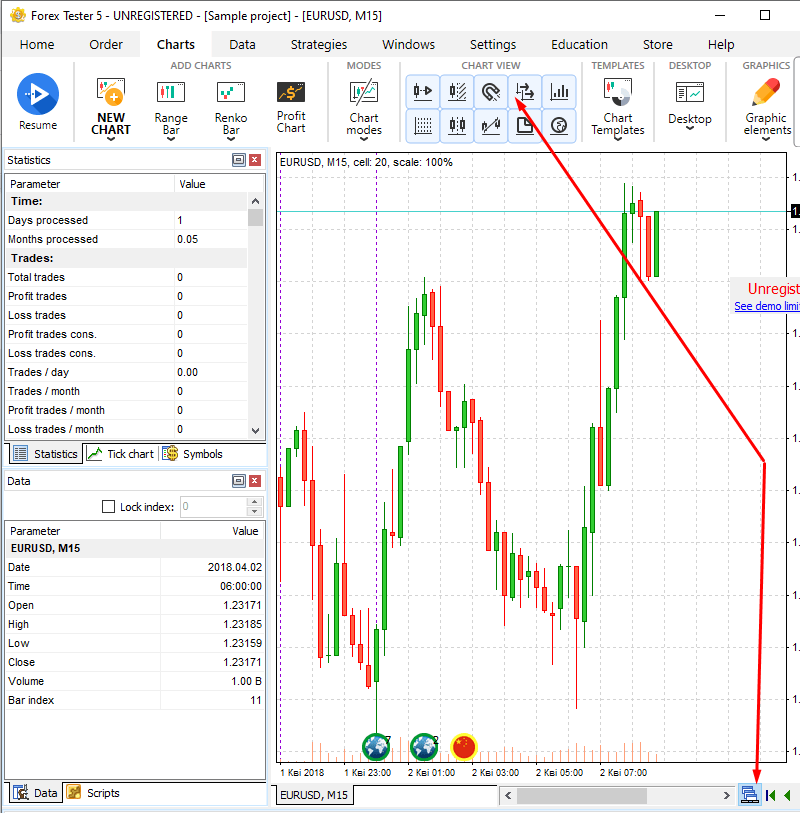
There are 6 modes of chart displaying in Forex Tester. You can switch between 3 of them (lines, bars, or candles) by clicking the “Chart modes” button on the Charts tab.

-
Lines mode is represented by a curved line connecting all Close prices.
-
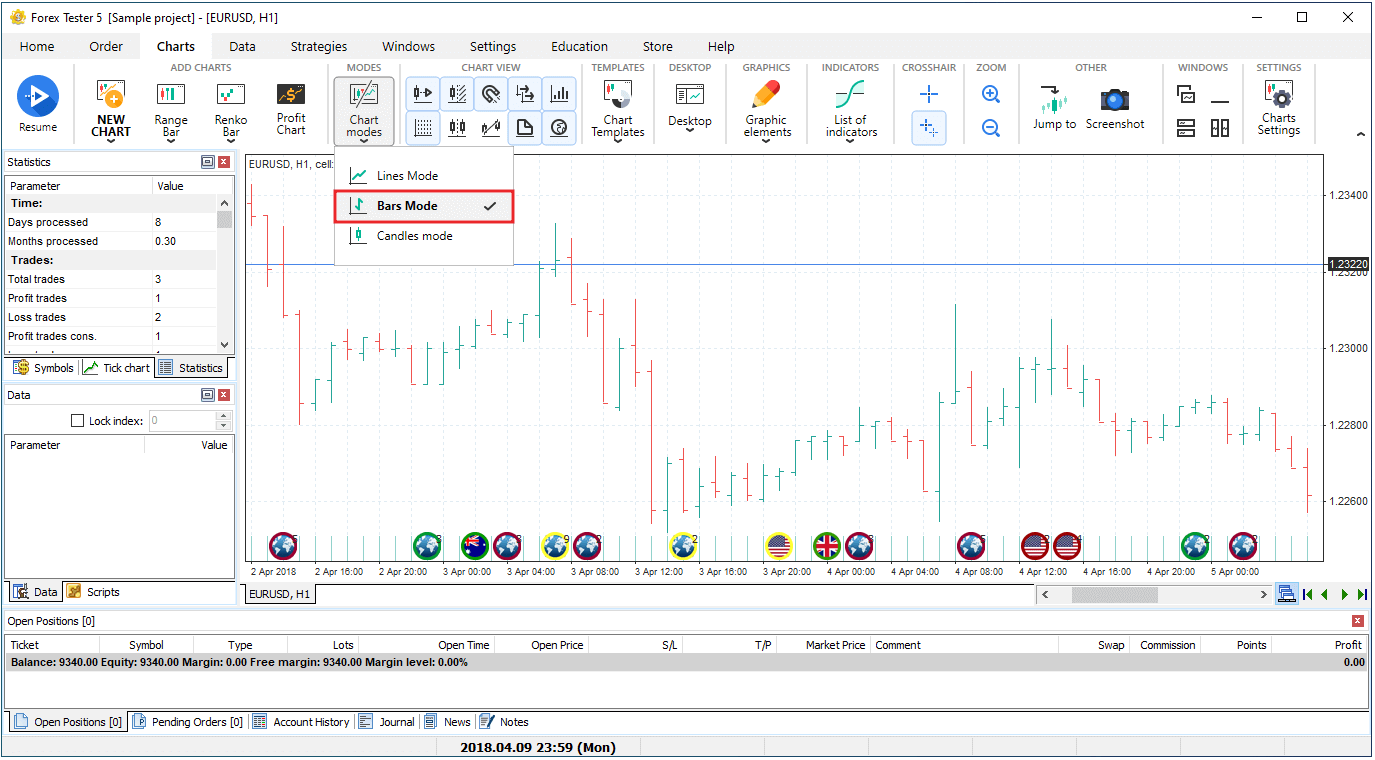
Bars mode consists of the vertical bars with horizontal line segments.
Vertical bars display the distance between the high and low of the current bar, whereas the left horizontal line shows the bar’s open price, and the right horizontal line — its close price.
-
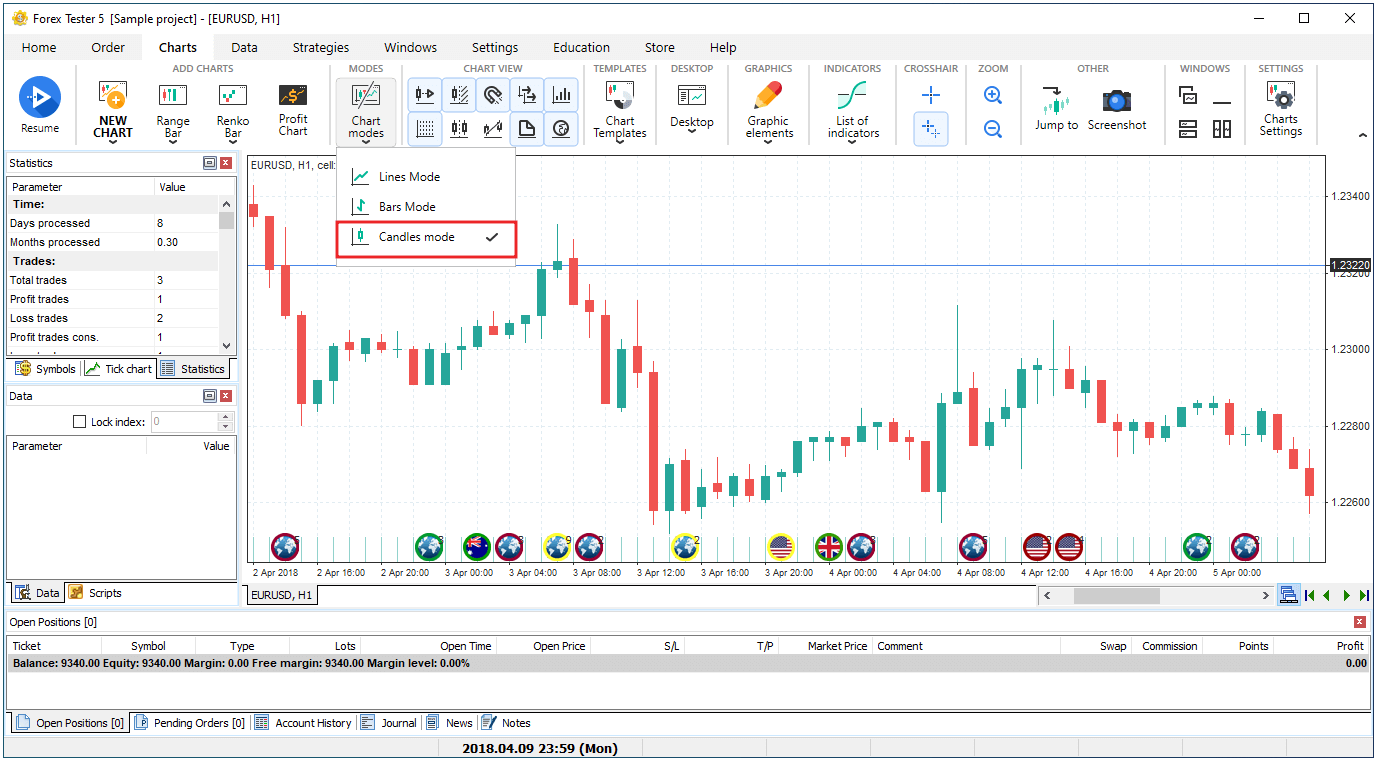
Candles mode is set in Forex Tester by default.
Candlesticks are vertical rectangles of two colors that might have upper and lower shadows.
-
Range bar mode shows the candles of the same adjusted size by considering the price only.
A new candle appears when the price passes a specified number of points, but if that doesn’t happen and the price moves in a narrow range, a new candle does not appear on the chart.
To switch to this mode, click the “Range bar” button on the Charts tab and choose the currency pair.
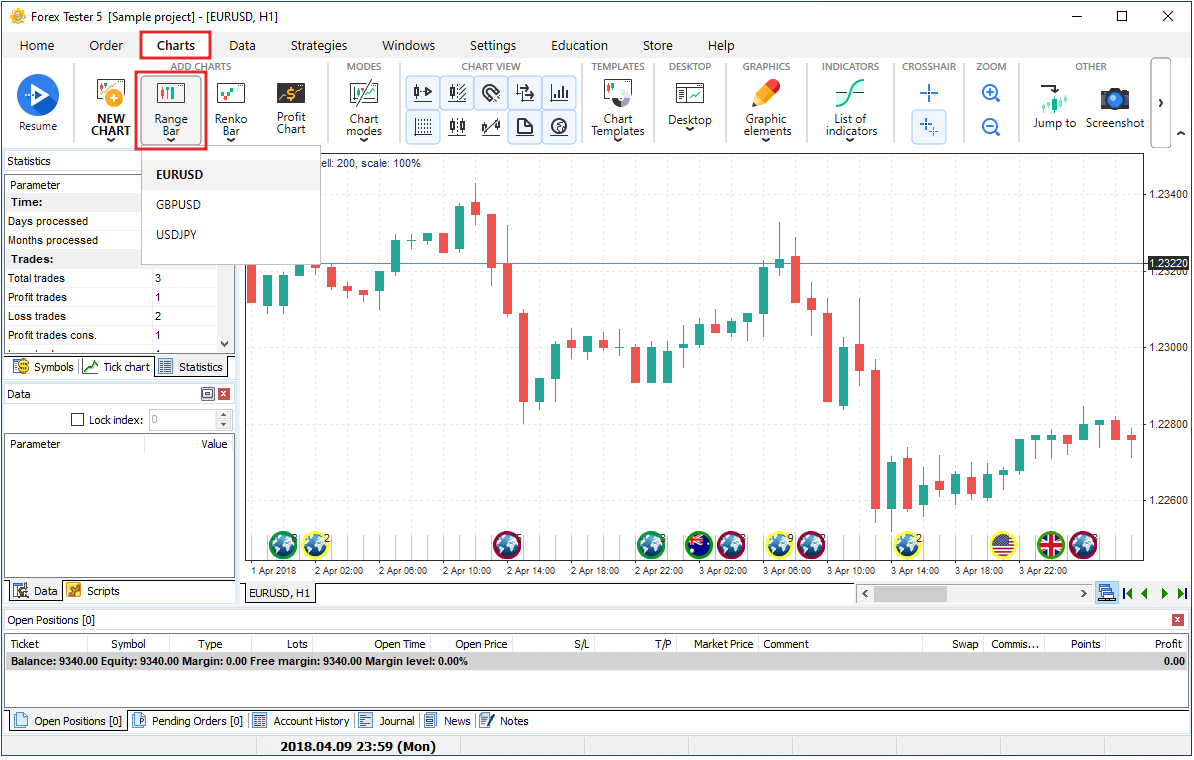
Forex Tester will ask you to set the range bar size. Insert the necessary value and click “Ok”.
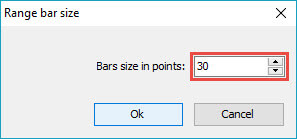
You will notice that each candlestick (or bar) is equal to the value you have entered.
-
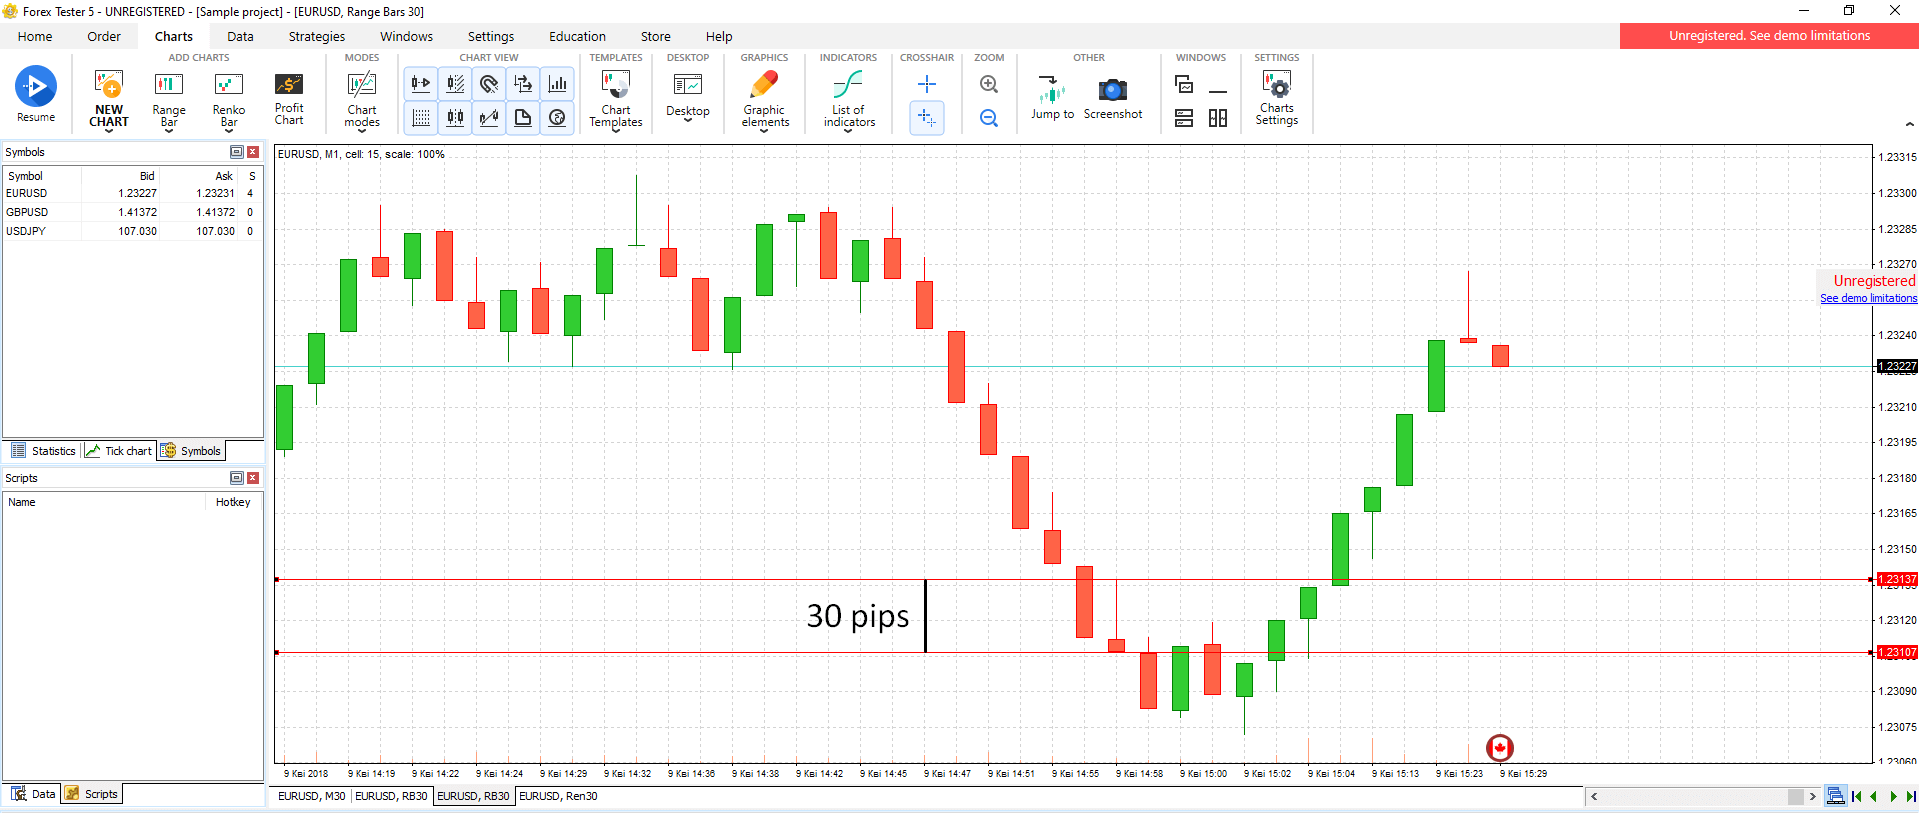
Renko bar mode also highlights the main trend by eliminating minor price changes.
The line made of bricks on the Renko chart continues to draw in the previous price movement’s direction only if prices change by a certain adjusted value. All bricks are the same size. Thus, on the Renko chart with a cell price of 5 points, a price increase of 20 points is shown as four bricks 5 points high.
The main signal of a trend reversal is the appearance of a new colored brick.
To open the Renko chart for a particular symbol, go to the Charts tab, click the “Renko bar” button, and select the necessary symbol. In the opened window, specify the bar size in pips and click “Ok”.
Note that the specified value for the Renko bar defines the size of the candle body only.
-
Tick chart mode shows every single price change within a current data range.
To switch to the Tick chart, click the Ticks tab located in the screen’s left upper corner.
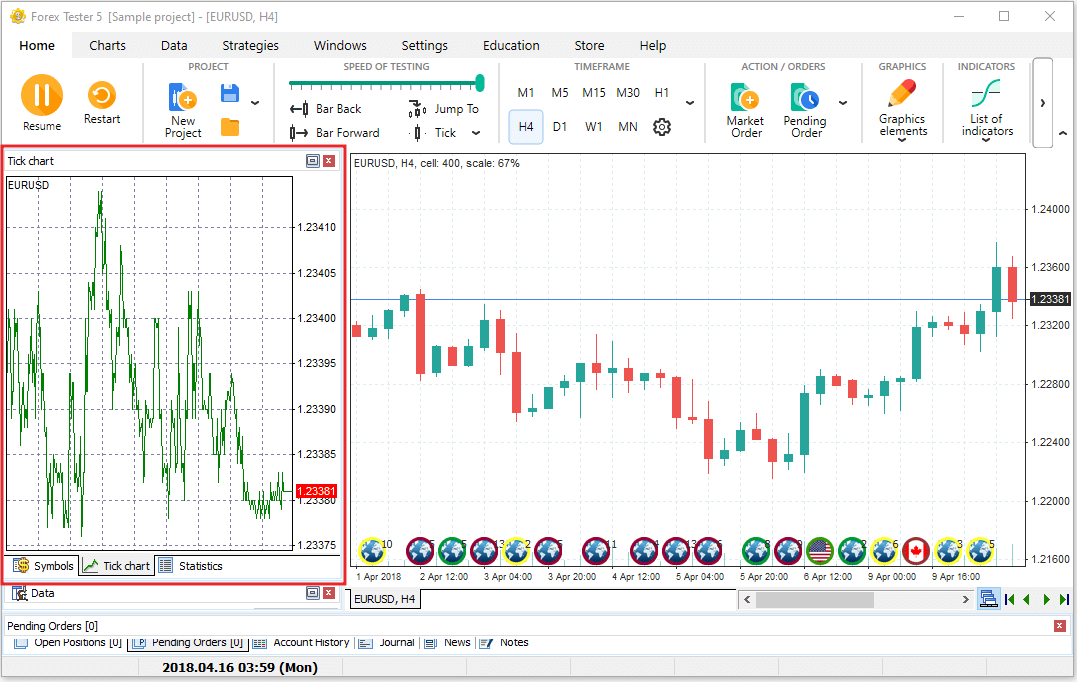
Chart settings
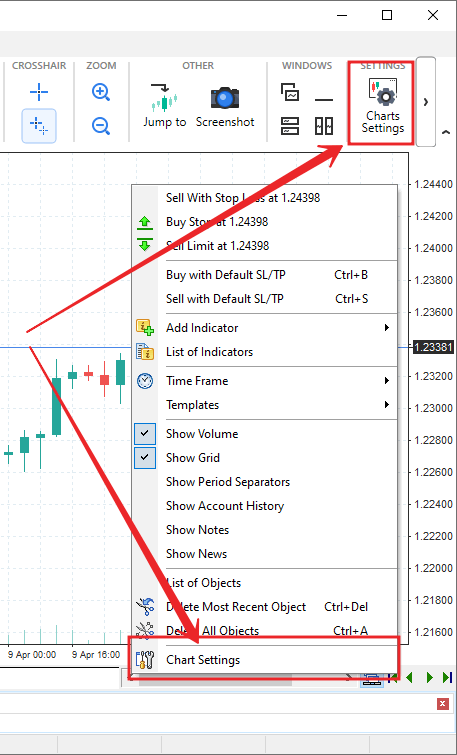
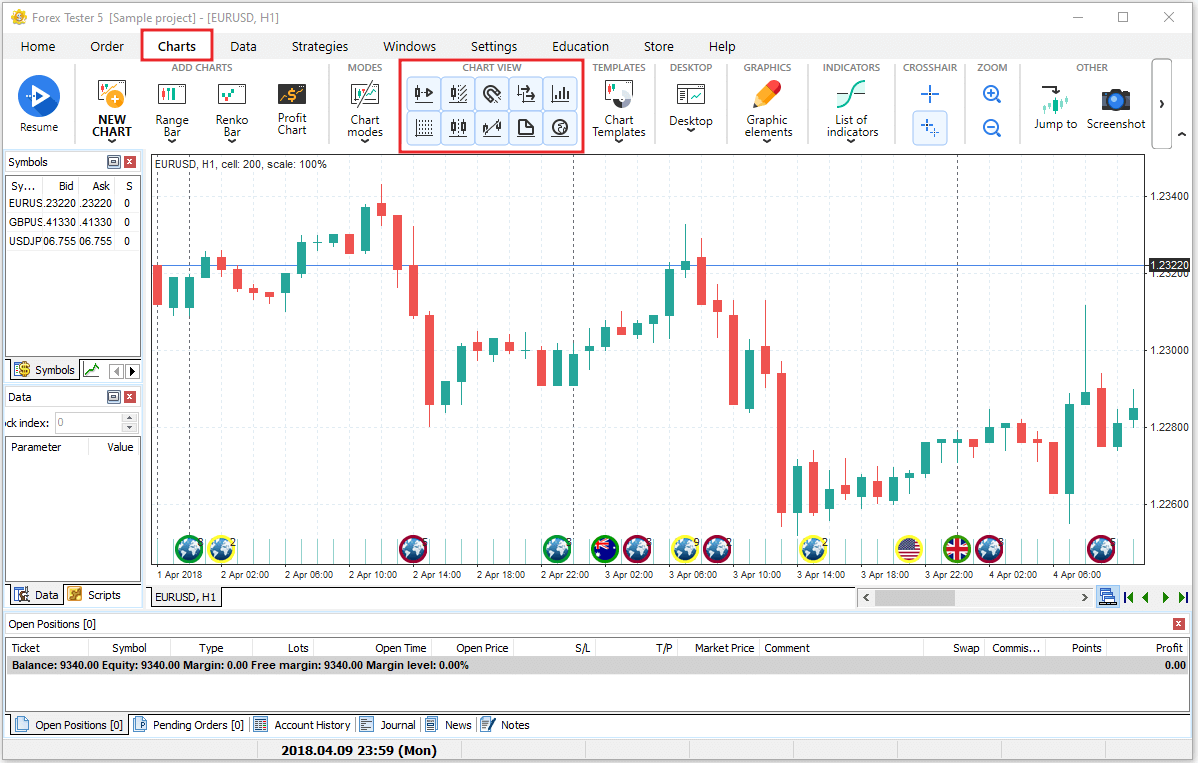
You can adjust the colors of the candlesticks and chart’s background by right-clicking on the chart and selecting the “Chart settings” option (or use the “Chart settings” button on the Charts tab).
There are three tabs in the Chart settings window:
-
The Color scheme tab.
There are nine color schemes available in Forex Tester.
Let’s change the default one to “Black on White”. It inverts the fills’ colors and sets the black borders for the candlesticks. Now the bullish candlestick has the white fill, whereas the bearish one — black.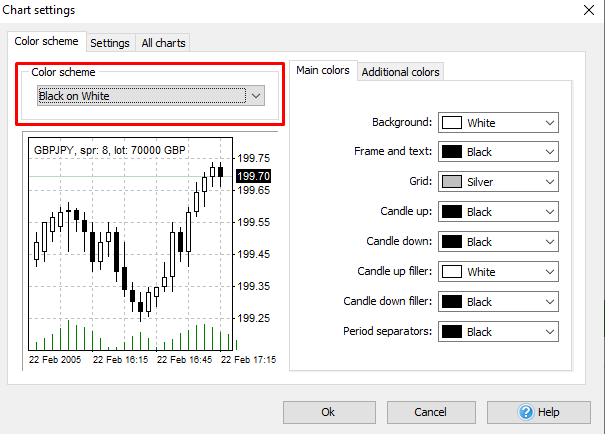
You can also alter the colors for:
- background
- frame and text
- grid
- borders of the candlesticks
- fills’ colors
- period separators
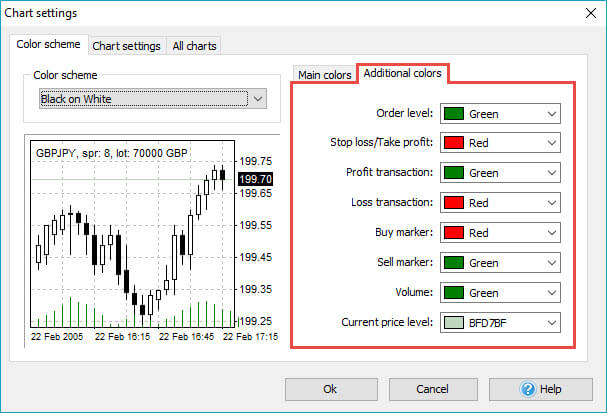
Switch to the Additional colors tab, and you will have access to other important lines that appear on the chart.
By default, Stop Loss / Take Profit values, loss trades, and buy order markers are colored in red. The orders’ levels, profitable trades, volumes, and sell orders markers are green.
You can set any color you like using a dropdown menu.
-
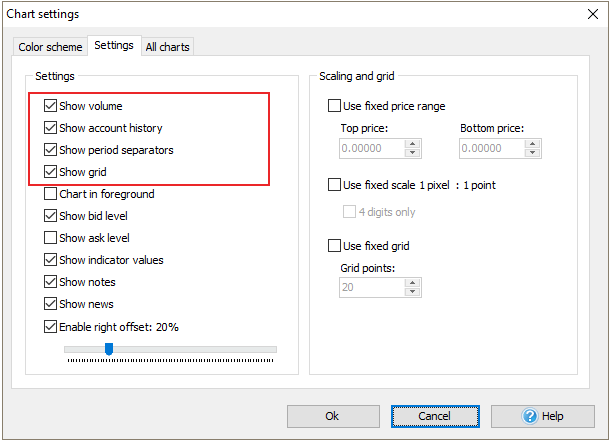
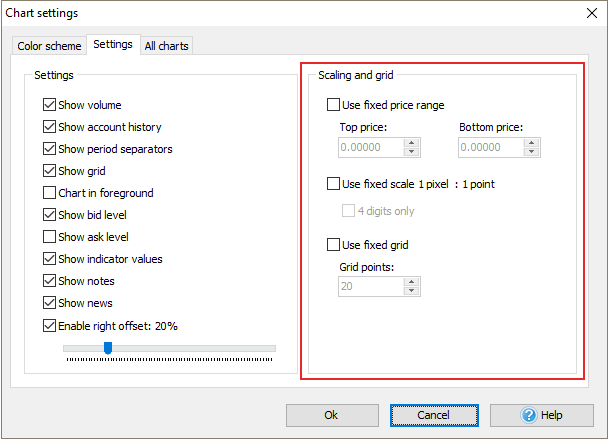
The Settings tab.
- Show volume — shows the volume indicator.
- Show account history — connects the open and close points of your trades with a line.
- Show period separators — enables the dotted vertical line showing the end of each trading day.
- Show grid — simplifies the navigation on the chart. Each grid line provides a trader with information about the price and the time of the candlestick.
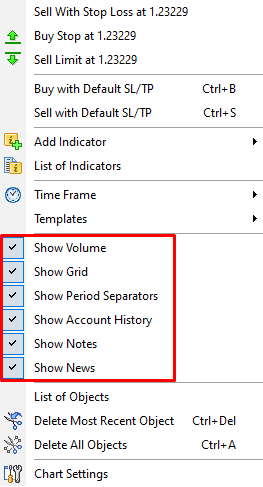
You can also enable or disable the mentioned parameters if you right-click on the chart.
Alternatively, you can navigate to the Charts tab and find these options in the Chart view section.
- Chart in foreground — shows indicators and account history line beneath the candlesticks line.
- Show bid level — displays at which price the sell order will be filled if you open a sell market order.
- Show ask level — shows at which price the buy order will be filled if you open a buy market order.
- Show indicator values — displays the indicator’s current value with red color at the price axis.
- Enable right offset: % — defines the clear space between the last candlestick to the price axis. If you disable this checkbox, then no space will be visible to the right from the candlesticks. You can adjust the offset using the slider.
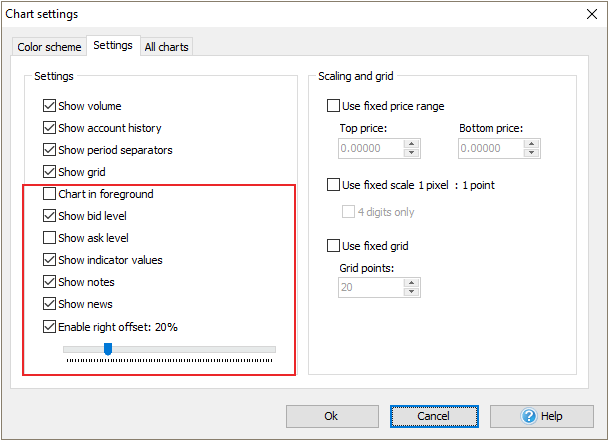
- Use fixed price range — displays the objects situated in the vertical range between the Top and the Bottom prices you set.
- Use fixed scale 1 pixel: 1 point — binds a one-point price change to 1 pixel of your monitor. The local maximum and minimum are always visible when it’s disabled. If you enable the checkbox, the candlesticks’ vertical size will be changed depending on your monitor’s screen resolution.
- Use fixed grid — allows you to set a custom distance for your grid’s line. By default, it’s drawn after every five pips.
-
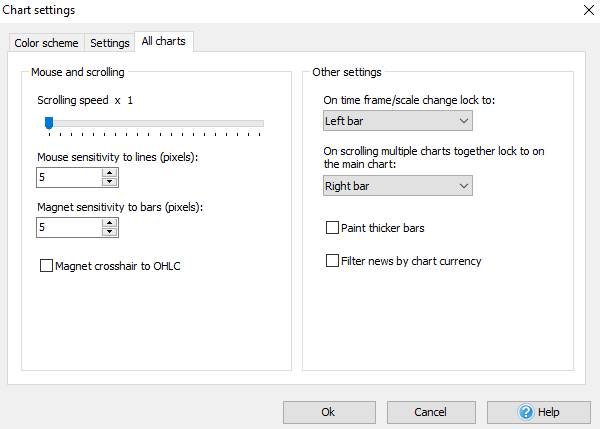
The All Charts tab.
Using this tab, you can adjust the following settings:
- Scrolling speed.
- Mouse sensitivity to lines.
- Magnet sensitivity to bars.
- Charts’ synchronization align type.
- Bars’ thickness.
- Alignment of candles, when the timeframe or scale changes.
To test the scrolling speed:
- Click anywhere on the chart and hold the mouse button.
- Drag the mouse either right or left to see the scrolling speed.
To test the mouse sensitivity to lines:
- Add any line to the chart by clicking the “Graphic elements” button on the Charts tab.
- Double-click the line on the chart and use the drag-n-drop method to reposition the element.
*If the mouse sensitivity value equals 3, then even if you click 3 pixels away from the line, you will still be able to move it.
All charts with the same currency pair are synchronized by default. When you’re scrolling within the same timeframe, all other charts will be scrolled automatically with the right calculation. For example, when you scroll 1 bar forward on the H1, the M5 timeframe chart scrolls 12 bars forward, respectively.
You can turn on/off synchronized scrolling by clicking either the
 button under the chart or the Chart view toolbar button
  .
.
There are 2 options to make the candlesticks either thinner and therefore include more of them on the chart without scrolling or thicker to make their appearance more prominent:
- Use the corresponding Magnifier on the toolbar
 .
. - Click the “+” or “–” key on your keyboard’s calculator.
For the chart’s windows reposition, use buttons on the Windows or Charts tabs:
- Cascade — stacks windows on one another.
- Tile horizontally — stretches windows from left to the right.
- Tile vertically — stretches windows from top to bottom.
- Minimize all — minimizes windows to the main program’s window bottom.
- Restore All — expands windows from minimized to normal.

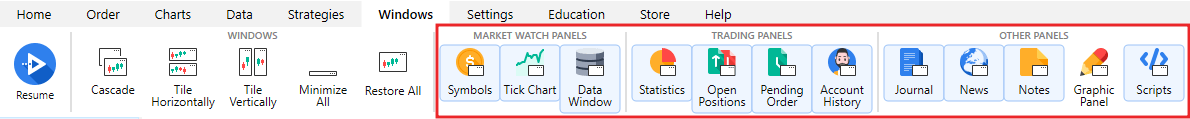
You can enable or disable any of nine panels available in Forex Tester. In order to enable/disable the necessary panel pease navigate to the “Windows” tab and click on the appropriate button:
- The “Symbols” panel displays all the currencies that are involved in the project. You will see bid and ask prices as well as the spread value.
- The “Tick chart” shows the price changes within the current bar.
- The “Data” window includes the information on the current bar such as: the date and the time when the bar appeared, the open, high, low and close prices, the tick volume and the bar index. To get information on the bar you need to hover your mouse on it. In case if you want the information regarding some particular bar to be displayed all the time no matter if you hover on this bar or not, please make use of the “lock index” checkbox and set the index of the locked bar. Please note that the bars count begins from 0 and not from 1. In addition, the calculation goes from right to left.
- The “Statistics” chart provides traders with all necessary information on their strategy’s performance.
- The “Open positions” tab displays all opened orders.
- The “Pending orders” tab shows the pending orders only.
- The “Account history” tab shows all the closed orders.
- The “Journal” provides users with the technical information on indicators that have been loaded, with orders placement, modification, and closing, with test start, end, etc.
To clear the "Journal" you can use the "Clear journal" button on the toolbar.
- 9. The “News” tab - here you can get detailed information about news calendar. Click here to read more about using news in Forex Tester.
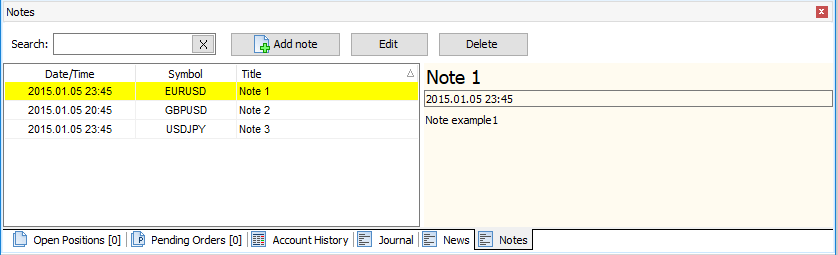
- 10. "Notes" Here you can create a note using the Add note button and also see a list of all created notes. Another way to add a note is to click on the button
 on the paint toolbar and select a bar to which the note will be linked after creation.
 - 11. The “Scripts” window contains all available scripts. Script is the algorithm that will be run once by the user’s demand.
After that the Edit note window will be showed.
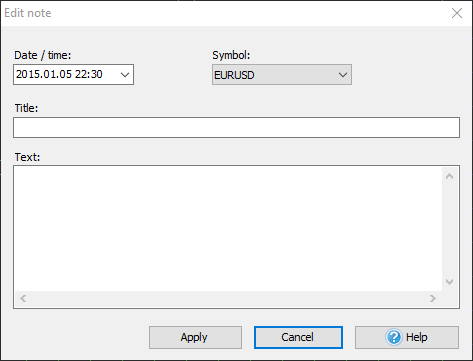
You can set up date and time of the note, select one or all symbols to link the note, enter the Title of the note and text.
You can quickly jump to the bar on the chart the note is linked with using double click on the note row.
Using right-mouse click the on the row with a note (or on the icon  on the chart) you can see the menu which allowing you to edit or delete it. Another way to delete a note is to click on the Delete button.
To hide notes icons on the chart, please use right-mouse click on any place of chart and uncheck Show Notes menu item.
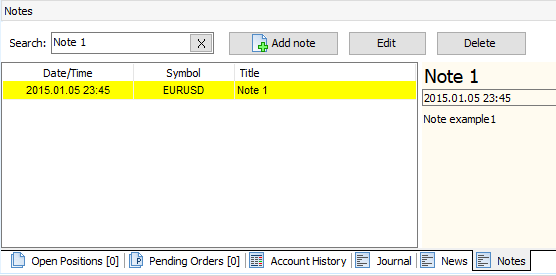
You have the ability to find the necessary note using the Search field. Please note that search works only through headers (names) of notes.
To open the program setting please switch to the "Settings" tab.
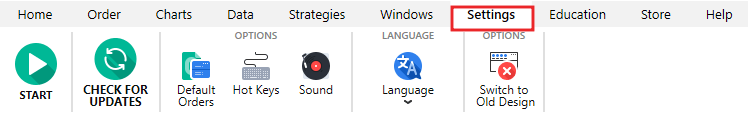
You can find the following buttons here:
- Check for updates
- Hot keys
- Sound - here you can customize Forex Tester sounds
- Language - you can select the language of program user interface
- Switch to Old Design - allows rollback to the old interface with panels
Check for updates - click this button to check for program updates manually.
The "Default orders" will be especially useful for you in case if you often open orders with the same parameters. For example, if your strategy requires opening of the order with the stop loss of 40 pips and the take profit of 60 pips with the same lot size of 0.2 then you can easily set it up.
- Click on the "Add" button
- Set the "0.1" value from the dropdown menu that is situated to the right from the "Lot" option
- Enter "40" manually or using the dropdown menu near the "Stop loss" option
- Enter "40" manually or using the dropdown menu near the "Take profit" option
- Add a comment if you need it
- Click "OK"
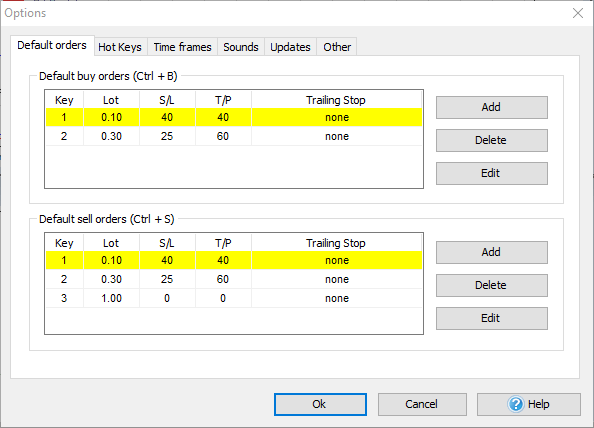
Now, you've added a default buy order. Whenever you need to open your standard order with the above-mentioned values, just make use of the CTRL + B shortcut.
The same procedure can be set for the default sell order that becomes placed with the help of the CTRL + S shortcut.
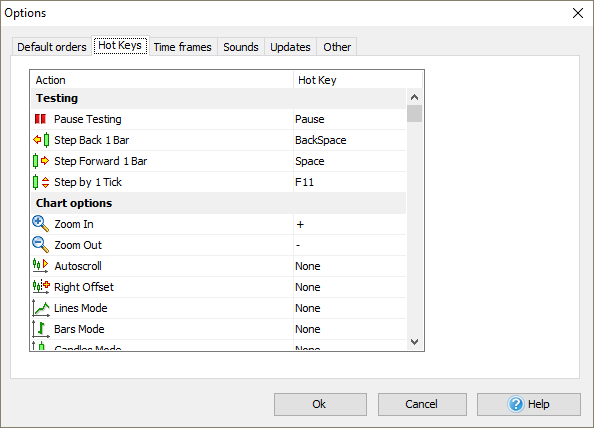
The second tab is called "Hot keys". Here you can find out all the actions that are applicable in Forex Tester and find their Hot Keys equivalents. If you need to change the existing hot key value or to set one for a non-set value, double-click on the shortcut name and then select a necessary shortcut from the dropdown menu.
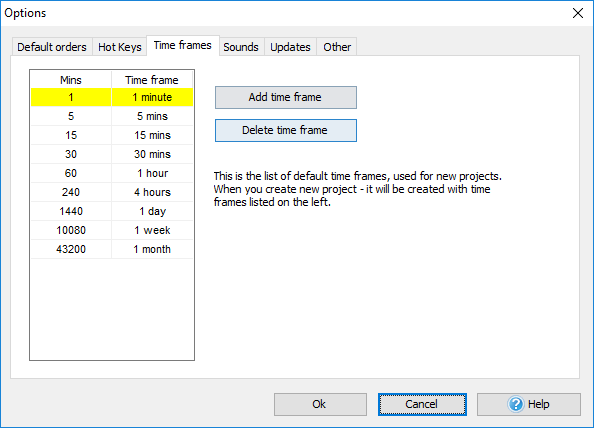
On the “Time frames” tab you can add or delete default time frames, used for new projects.
You can add a custom time frame by clicking the Manage Time Frames button  on the Main toolbar. In the Edit Time Frames window, you can make this list of time frames default for your new projects by clicking on the “Make default” button.
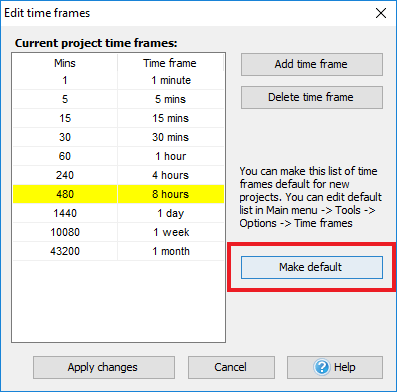
You don’t need to create custom time frame for every new project – just do it one time and save your new list of time frames as a default list. When creating a new project, your custom time frame will be also represented among other default time frames.
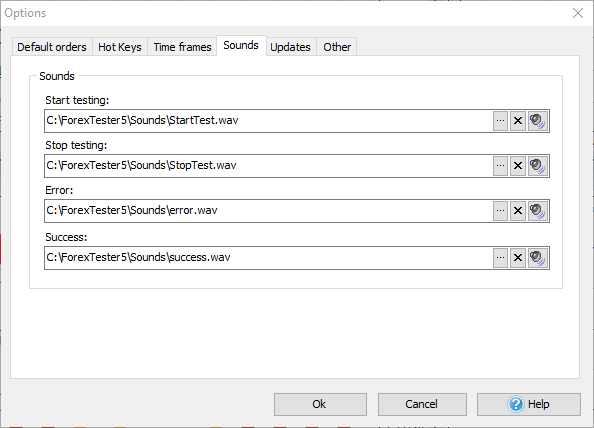
In the "Sounds" tab, you can set, delete or listen to the 4 sounds that exist in Forex Tester. These sounds represent the .wav files that will be played when you start or stop the test when an error or a successful action occur.
To set your own audio file, click on the "Open file dialog" button.
To delete the sound use the "Cross" button.
To listen to the existing sound, click on the "Speaker" icon.
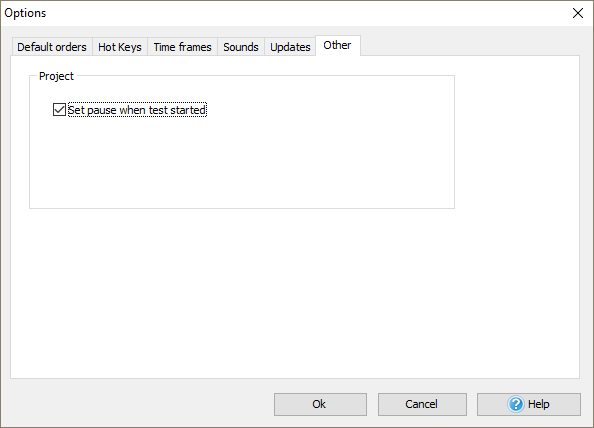
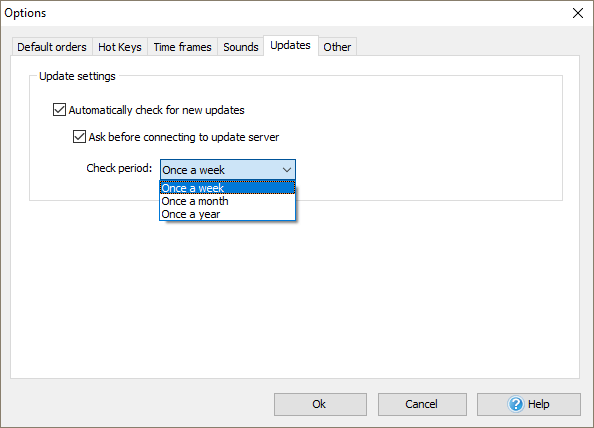
In “Updates” tab every user can set periodicity of updates from server requests. You can also disable this setting so the program never tried to update till the newest version.
In “Other” setting “Set pause after start test” can be activated. When this option is enabled, after clicking on “Start Test” button new bars will not appear till you click on “Pause”.