Double Bollinger Bands Forex Trading Strategy
Every forex trader encounters a simple question at some point: “Should I keep opening positions in the same direction, or should I just take profits and stop trading?” In other words, will the current trend continue, consolidate or reverse? A more detailed analysis suggests a larger number of factors and questions such as assessing the trend momentum, pivot points and resistance/support levels, looking at several timeframes and monitoring dozens of technical indicators.
The deeper you dig, the tougher the answer gets. At the same time, traders are usually aware that it’s better to avoid complicated trading systems when the current price is not even seen behind the bunch of indicators added to the chart. So the right answer might come from a simple, reliable and effective trading strategy which could be applicable for different market conditions.
Here comes the Double Bollinger Band strategy - a trading system that is flexible in terms of correlations with one of the most important technical factors - volatility. The Double Bollinger Band strategy shows essential support and resistance levels, highlights breakouts and reversals, as well as points out a range where the trend continuation is most probable.
Double Bollinger Bands Strategy Description
The Double Bollinger Bands strategy is multi-purpose and suitable for Forex trading. The system works well for sideways ranges as it’s based on the Bollinger Bands indicator designed exactly for such periods when prices bounce off support/resistance level, move to the opposite side of the range, reverse and go back again, repeating that cycle several times. The Double Bollinger Bands strategy also works well in strong trend periods, showing the depth of possible retracements and indicating moments when chances to reverse the trend are getting higher. It also takes into account the volatility which is crucial for technical analysis.
Double Bollinger Bands could be used in a wide range of currency pairs, as well as many different timeframes in order to increase the efficiency of trading decisions, which has a strong impact on the profitability of trading at the end of the day.
We should not waste your time describing the Bollinger Bands formula and telling how it was developed. The best way to understand all of its advantages is to use it in practice, backtesting the indicator in various conditions manually. We’d mention just some Bollinger Band features here.
Unlike traditional Bollinger Bands trading strategy that suggests using three lines, the Double-Bolli system operates with five lines. The middle line coincides for both indicators as the moving average has the same period. Double Bollinger Bands settings add one more range that is in the middle between traditional three lines. The range has to be considered as a set of additional support and resistance lines.
For example, during an uptrend, a currency pair could bounce off the upper line, retrace to the next support level, reverse, and continue the bullish price action. So instead of waiting for a test of the Bollinger Bands middle line, traders could enter the market earlier, maximizing potential profits.
As a result, the Double-Bolli system expands possibilities of the Bollinger Bands strategy, increasing the number of trading signals and chart patterns for a detailed analysis.
A Couple of Words About the Bollinger Bands Indicator
The Bollinger Band indicator is a simple-to-understand and easy-to-use technical tool which shows several market conditions such as the average price, resistance and support levels and current volatility. The indicator isn’t static, all of the three lines are moving with the price, reflecting recent fluctuations.
Bollinger Bands indicator is rather flexible as traders can choose the period of the range calculation, which allows analyzing a wider range of financial instruments and timeframes. The default Bollinger Band settings suggest a period of 20 bars (hours or days depending on the timeframe) as most of the traders like round figures, and deviation 2.0. But we recommend enlarging the period by at least 21 bars (one of the Fibonacci numbers) or 34 bars to see how Bollinger Band width correlates with the period.

The longer period you choose the less fake signals you get. Therefore, periods like 34 and 55 bars would work more effectively. Longer periods are useless as the Bollinger Band indicator becomes too lagging, taking into account too old prices which are out of the current interest at the time of trading decision.
Best Currency Pairs to Trade on
Traditional assets to trade on with the Double-Bolli trading system are EUR/USD and GBP/USD among currency pairs, as well as silver and gold among commodities. The system works best for sideways ranges so it’s worth considering cross-rates such as EUR/GBP, EUR/CAD, AUD/NZD, and GBP/CHF.
It’s also highly recommended to develop a personal money management strategy based on individual financial goals, the volume of trading accounts and risk factors. The best way to do that is to backtest your Bollinger Bands strategy manually or automatically, using the Forex Tester software.
How to Build the Chart Setup for the Double Bollinger Bands Forex Strategy
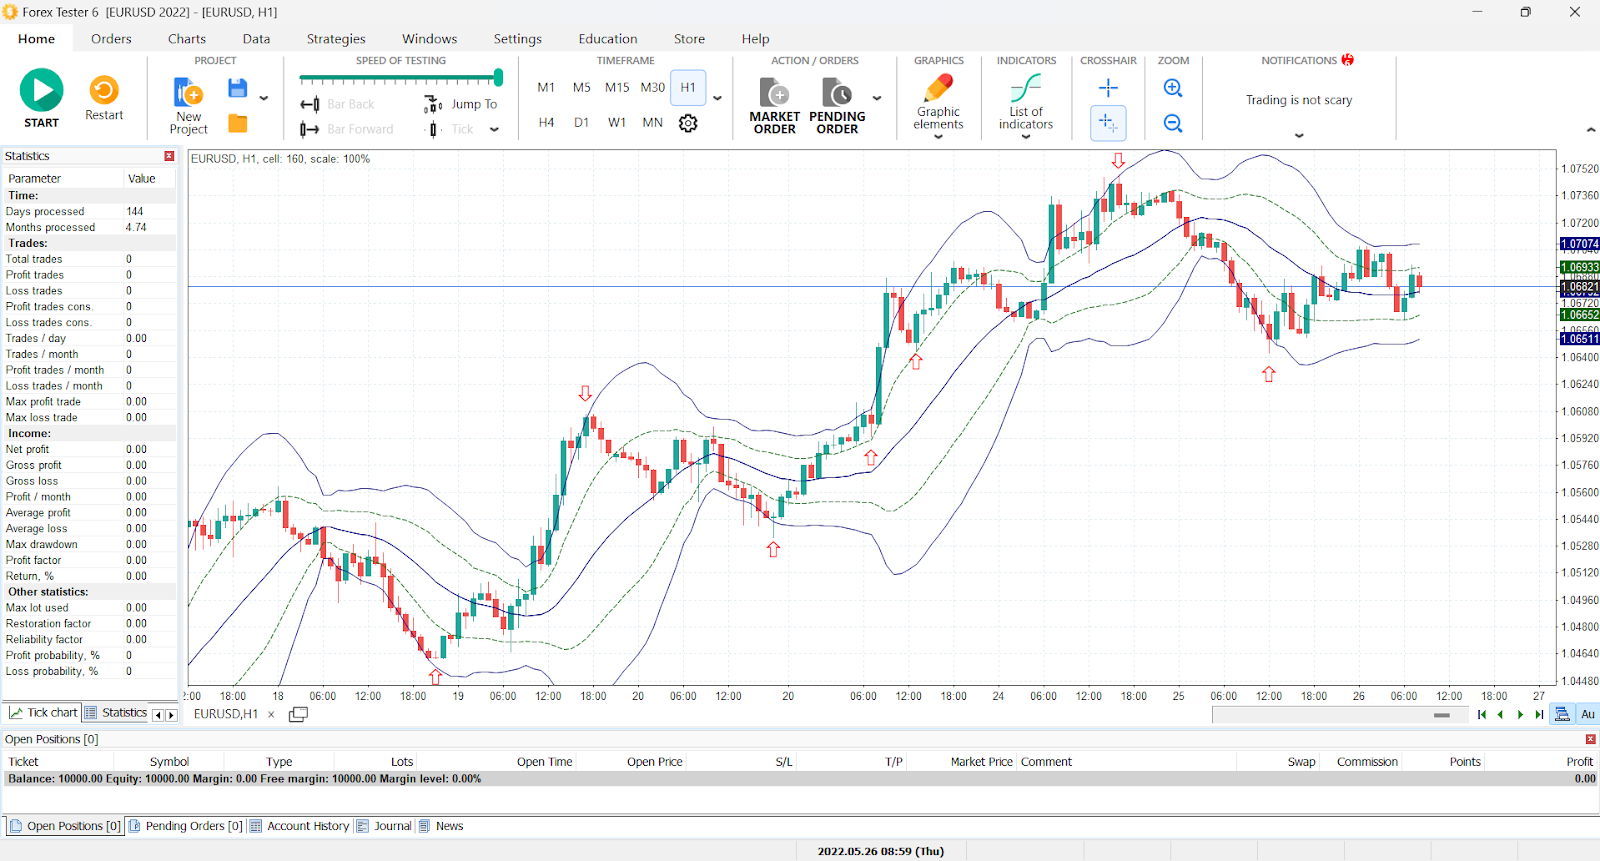
Before we move forward to practical examples, we need to explain in detail how to build the chart setup for the Double Bollinger Bands Forex strategy. We need to open an advanced chart, choose an asset (EUR/GBP, for example) and set the time frame (1- and 4-hour are recommended). Then we add the first Bollinger Bands indicator, double click on it and change the period from 20 to 21.
Next, we add one more Bollinger Bands indicator and change its settings. The period has to be the same as for the first one but the deviation has to be modified from 2 to 1. The style of the second Bollinger Bands indicator has to be changed just to get a better visual presentation and not to mislead ourselves. For instance, a different color for the Double Bollinger Bands indicator works fine. As a result of all those manipulations we get the following picture:

Practical Examples of Using Double Bollinger Band Strategy
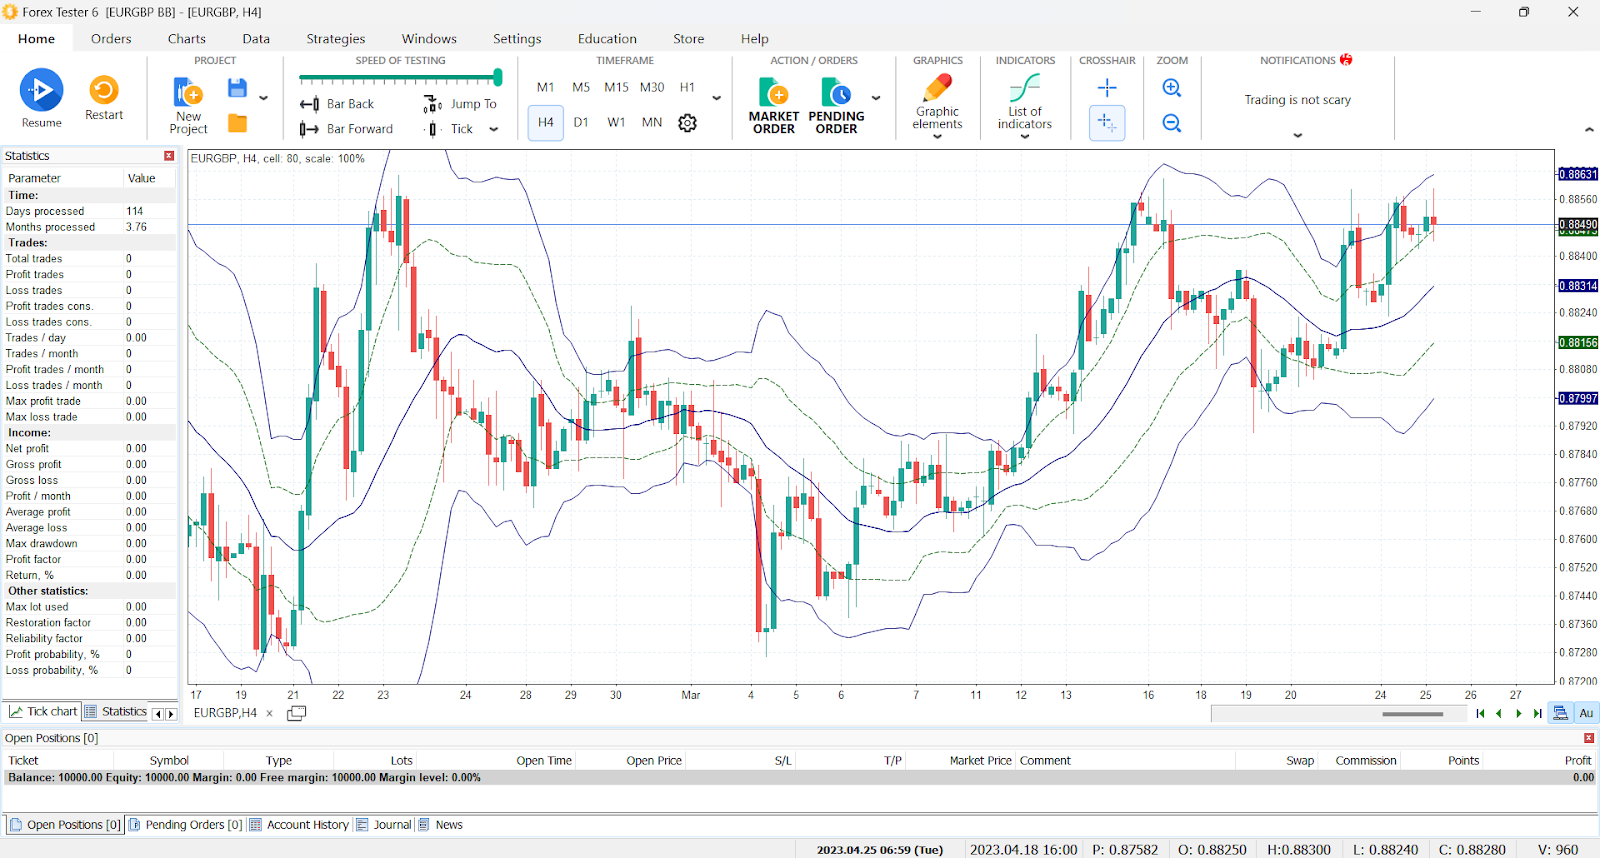
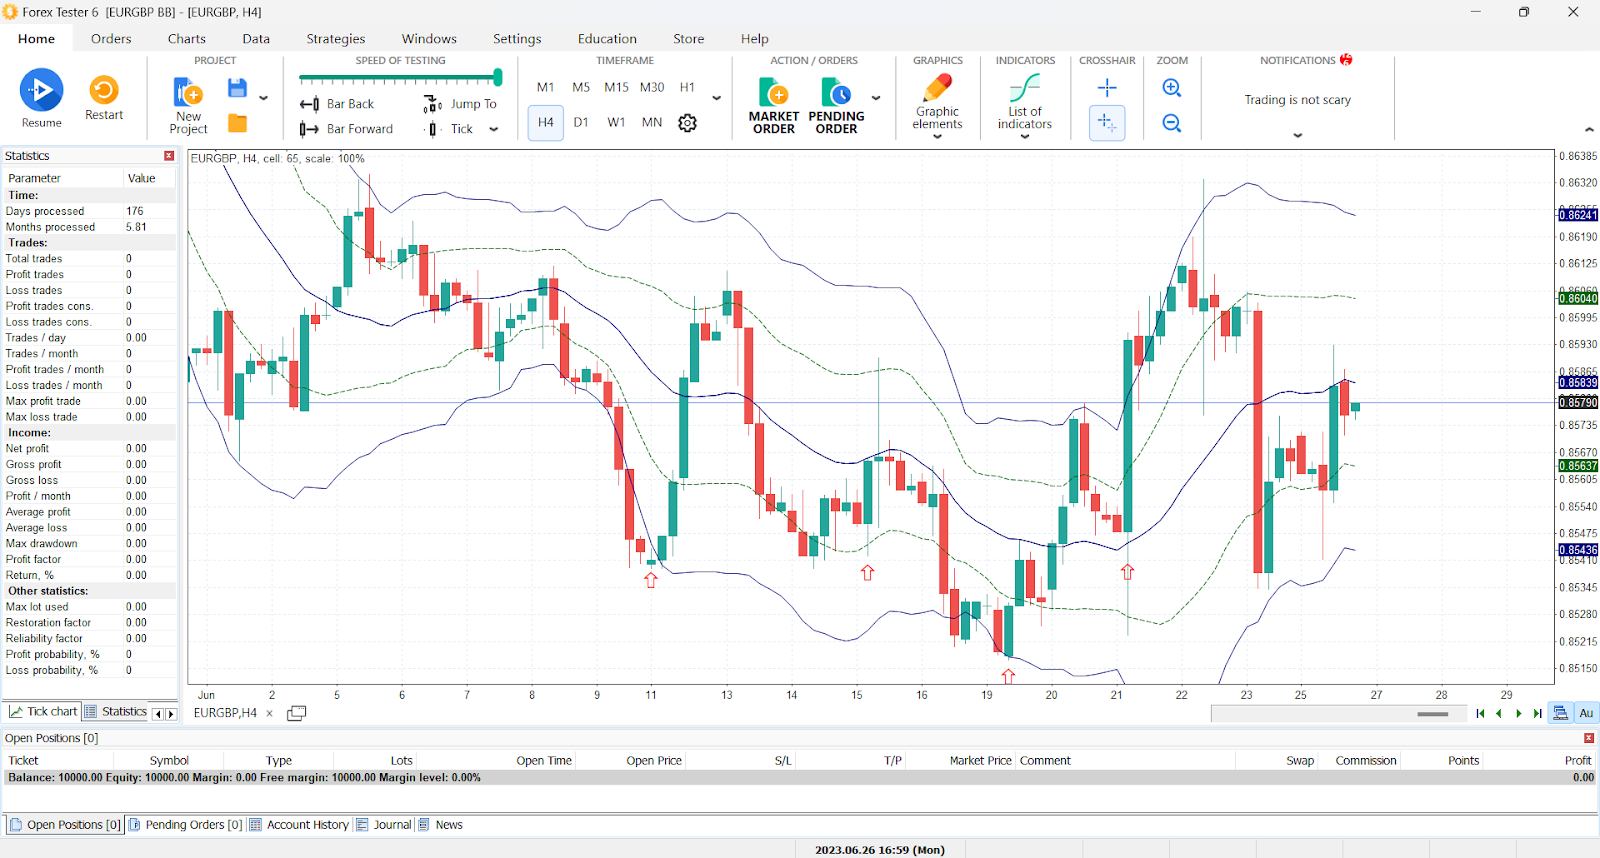
Here is a description of a forex trading approach using the Double Bollinger Band trading strategy. The chart below shows EUR/GBP on the one-hour timeframe. The first sign for us to pay attention to is when the price comes from a candlestick which closed the hour below the lower Bollinger Band. At the same time, the range of the Double Bollinger Bands indicator spread, pointing to a period of large volatility after the tight consolidation range without meaningful price action. Volatility is the best friend of a currency speculator!
We wait until EUR/GBP fails to confirm the bearish breakthrough as two candlesticks close above the lower Bollinger Band line, which is the reversal bullish signal. We open longs then.
The first resistance of the middle Bollinger Band line did not hold prices from further strengthening, so we just ignored that line. Aggressive traders could add more volume for long positions as the technical sentiment changed to bullish.
Next, the pair breaks through the upper band and closes the hour near the highest rate which is the confirmation of the bullish signal, so we keep holding the long position. The next alert comes from the long upper shadow on the hourly candlestick, which points to the fact that the uptrend is getting exhausted. The signal to take profits comes two hours later when the price slides back below the upper Bollinger Band line. We take a wait-and-see position there, having a break.
After that, another breakthrough occurred when EUR/GBP sank below the upper band with deviation 1. We open shorts to hold them until the pair charts a long downside shadow and the candlestick fails to close the hour below the second lower Bollinger Band line. We take our money and run away until the next entry signal comes.
Technical Information
Indicators: Bollinger Bands (period 21, deviation 2), Bollinger Bands (period 21, deviation 1).
Timeframes: 15 min and above (we backtest on 4H timeframe).
Currency pair: Any cross-rates preferred, we take EUR/GBP as an example.
Stop Loss/Take Profit: 20/40 points (four-digit quotes).
Long trade entry rules:
-
A candlestick closed above the Double Bollinger Bands bottom line, long downside shadow is a plus.
-
During an uptrend, the price charted a bullish breakthrough signal, closing above the Double Bolli’s upper line. We wait for a pullback towards the next support line (yellow), and open longs if a candlestick is closed above it.
-
A deep bearish retracement towards the middle Bollinger Bands line occurred after an uptrend. If the price closes above the middle line support curve, we open longs.
Short trade entry rules:
-
A candlestick closed below the Double Bolli’s upper line, long downside shadow is a plus.
-
During an uptrend, the price charted a bearish breakthrough signal, closing below the Double Bolli’s bottom line. We wait for a pullback towards the next resistance line (yellow), and open shorts if a candlestick is closed below it.
-
A deep bullish retracement towards the middle BB line occurred after a downtrend. If the price closes below the middle line resistance curve, we open shorts.

Double Bollinger Bands Strategy Backtesting Results
We have manually backtested the Double Bollinger Band strategy on the EUR/GBP currency pair as that’s the most liquid cross-rate in the Forex market. We took the 4-hourly chart to lower the number of fake breakouts and avoid volatile periods on shorter timeframes. We used a manual testing approach with several additional conditions for entries and exits. Here are the results.
Testing period: 01/01/2023 - 28/02/2023
Testing period length: 2 months (57 days)
Symbol: EUR/GBP
Indicators: Bollinger Bands (period 21, deviation 2), Bollinger Bands (period 21, deviation 1, yellow)
Timeframe: 4 hours
|
Total trades |
36 |
|
Profit trades |
20 |
|
Loss trades |
16 |
|
Profit trades cons |
5 |
|
Loss trades cons |
4 |
|
Trades per day |
0.62 |
|
Trades per month |
19 |
|
Profit trades per month |
10 |
|
Loss trades per month |
8 |
|
Max profit trade |
$1,292.54 |
|
Max loss trade |
$1,501.11 |
|
Initial deposit |
$10,000.00 |
|
Net profit |
$3,701.38 |
|
Gross profit |
$14,270.86 |
|
Gross loss |
$10,569.48 |
|
Profit per month |
$1,942.42 |
|
Average profitability per month |
19.42% |
|
Average profit per trade |
$713.54 |
|
Average loss per trade |
$660.59 |
|
Profit-to-loss ratio |
1.08 |
|
Max drawdown |
$3,278.36 |
|
Max drawdown to max balance |
23.92% |
|
Max drawdown to average balance |
27.66% |
|
Profit factor |
1.35 |
|
Overall Return |
37.01% |
|
Max lot per trade used |
2.00 |
|
Restoration factor |
1.13 |
|
Reliability factor |
59.00% |
|
Profit probability |
56.00% |
|
Loss probability |
44.00% |
Conclusions
Of course, the example mentioned above describes a perfect situation when both longs and shorts were in the money. However, the efficiency of the Double Bollinger Band strategy speaks for itself. Besides, testing results suggest further development of the strategy, especially in the scope of lowering the noise and loss trades, limiting drawdowns, and increasing the percentage of profitable trades.
One of the largest advantages of the Double Bollinger Band strategy is that it is flexible and multi-purpose. Traders can make additional choices of whether to enter the opposite price action or just leave things as they are, having a decent profit on the one-way trend before the reversal happens. At the same time, there are also examples of boosting the volume according to the by-trend basis when a bullish breakthrough signal occurred and the retracement was limited by the second Bollinger Bands upper line.
Anyway, every trading system has to be tested individually and an exact trading algorithm can be worked out only in accordance with money- and risk-management rules, general personal trading approach and other individual factors. This is exactly where the Forex Tester app comes into play as you can backtest your trading systems manually, using highly accurate historical data together with the full functionality of the software.
Further Adjustments for Better Results
We’d consider increasing the period of the Double Bollinger Bands chart setup to 34 bars. That step would lower the number of trading signals and thus entries. On the other hand, we could get fewer fake breakouts and better profit-to-loss ratio.
It’s also worth backtesting the Double Bollinger Band strategy on other currency pairs to spot better patterns, especially when it comes to trending periods. The Double Bollinger Bands formation can be used together with mean-reversion trading strategies during sustainable trends.
Besides, the risk management rules can be adopted for a particular asset and various market conditions.
Try Double Bollinger Band Strategy Yourself
As you can see, backtesting is quite a simple activity in case you have the right backtesting tools. The testing of this strategy was arranged in Forex Tester with the historical data that comes along with the program.
To check this (or any other) strategy’s performance you can download Forex Tester for free. In addition, you will receive 22 years of free historical data (easily downloadable straight from the software).
What do you think about such reading of the Bollinger Bands indicator? What are other ways to utilize this indicator you know? Is Bollinger Bands one of your favorite trading tools? What other indicator suits it better?