Backtest MACD Indicator to Use Momentum for the Greater Accuracy
The MACD indicator is a variation of the moving average crossover and represents a smoothed difference between two exponential moving averages.
The moving average convergence-divergence is one of a trader's most potent technical tools.
It is also one of the simplest and highly versatile, as it can be used to trade trends and the range.
The MACD technical indicator is based on the insight that more can be learned about price behavior from the interaction between moving averages than from the moving averages themselves.
So let's take a closer look.
The MACD value is created by:
-
forming a short-term and long-term smoothed trendline from the original price series,
-
subtracting the long-term from the short-term, and finally,
-
applying another smoothing to the newly generated prices.
Here's the point.
We are taking two trend-following indicators (moving averages) and turning them into trend following momentum indicator.
Changes in the momentum precede changes in the price
One of the significant technical analysis concepts is that the change in momentum leads to a change in price.
This idea is highly reasonable if one observes what happens during a decisive directional move.
Think about it this way.
Suppose that the market is in an uptrend.
Bulls have bid the price up, creating higher highs.
Usually, the market will behave in the following matter:
-
First, prices will break out as early buyers pile into the currency, anticipating a rise.
-
Initially, prices will break out as early bulls open long positions anticipating a rise.
-
Then more traders seeing the market rise will join the action hoping to extend the trend.
-
Additionally, bears deep in the lost territory would begin to sell, realizing they are on the wrong side of the trend.
This sequence of events would only propel prices higher, and then the rest of the crowd will jump on the bandwagon, hoping prices will continue their progression.
At that point, the most smart money who wanted to be long have already established their positions, and the rate at which new highs appear slows.
The early bulls, who have acquired significant profits, start liquidating their positions, seeing prices level off.
All of this translates into a straightforward fact - velocity has slowed.
It comes down to this.
Momentum will usually taper off before the price stops its progression and change direction.
Reading the MACD indicator
Since the MACD plots the difference between two moving averages, the idea is that if prices rise, the short-term moving average will increase faster than the long-term moving average.
MACD, therefore, will slope upward.
The opposite dynamic will happen if prices decline.
MACD is an unbounded technical indicator, but it does oscillate around zero, with values becoming increasingly optimistic as prices rise and increasingly hostile as they fall.
The MACD plots the difference between two moving averages instead of the moving averages. Consequently, it is far less affected by choppy markets as it filters out the noise.
The MACD is plotted with its trigger line, simply the 9- period exponential moving average of the MACD itself.
Much like the moving average crossover, the trigger line signal is traded when the line crosses from the upside or the downside.
The MACD indicator signals are always triggered later than the price action because MACD is generally slower.
These signals are more precise than moving average crossovers, even though they come in later.
In 1986 Thomas Aspray invented the MACD histogram, improving the original idea.
The histogram is a visual way of representing the difference between the MACD signal line and its trigger line.
It fluctuates around the zero line, where the trigger line and the MACD cross.
With rising prices, the MACD will move away from its trigger line, as the MACD tends to increase faster.
It all comes down to this.
At its core, the MACD histogram calculates the velocity of price movement. Still, its real value is that it is a very effective momentum indicator, offering a powerful clue to future price direction.
The most common uses of MACD in trading include:
-
the MACD crossover trading strategy
-
the divergence
-
the divergence with trendlines
-
as an overbought/oversold tool
-
the MACD "turn"
-
MACD's peaks and troughs.
A more detailed breakdown of these strategies is presented below.
Trading the MACD crossover
The most prevalent use of the moving average convergence divergence is as a trend indicator, and the most important signal is when the faster moving average breaks, the slower one, indicating that a trend might be emerging in the same direction as the cross.
With that specific aim, one way to apply the MACD and signal line are as follows:
-
But when the MACD line (faster) crosses above the signal line (slower).
-
Sell when the MACD line crosses below the signal line.
Trading the divergence
Divergence is one of the fundamental ideas in technical analysis.
Its purpose is to signal ahead when prices are about to change direction.
To find divergence on the chart, follow these directions:
-
Locate the Highest Price peaks on the chart.
-
Find two consecutive rising peaks.
-
Draw a line connecting them.
-
Observe the MACD line directly below the line drawn in the upper part of the chart. Find a peak in the MACD corresponding to a peak in prices. Connect the two peaks in the MACD line.
-
One line is drawn on top of the price highs. The other is across the MACD peaks. We have a divergence whenever those two lines are angling in opposite directions.
A bearish divergence occurs when prices move higher and the MACD moves lower.
This divergence represents an essential piece of data because the MACD is not confirming the bullish move but indicating that the market has a bearish bias.
Bullish divergence happens when the opposite occurs.
The market is dropping, but the moving average convergence divergence is rising as prices are about to change direction.
Divergence is one of the most useful indicators, and as you look at it closer, you will see that the divergence is often created when the newer price peaks get farther apart.
Divergence is most effective when it is unambiguous.
However, if the price peaks are almost the same height and the MACD line is nearly horizontal, then the result of the divergence may need to be clarified.
Anticipating the divergence
Once you get better at recognizing a divergence, you'll want to get in as early as possible.
Usually, we enter a bearish divergence after the second histogram peak is completed, which is lower than the previous peak.
But here's something exciting.
We can do better.
When the market moves above the previous high, we start looking closer at the MACD.
If the MACD value is less than the previous MACD high when the market breaks out to the upside, we must start selling now.
The following is one way of handling anticipatory action.
Divide your funds into three parts:
-
Sell the first third when the market makes a new high, and the MACD is much lower than the previous peak.
-
Sell the second portion when the MACD line is within 20 % of the prior MACD peak.
-
Sell the third portion after the MACD line crosses the signal line on the way down.
Exiting a divergence trade
We can think of a divergence as a particular case of the overbought market.
It has reached new highs but slowed down, giving every sign of wanting to change direction.
Like any other overbought situation, the trade is over once the market has returned to a neutral state.
In the case of divergence, that occurs when the moving average convergence divergence value reaches zero.
Although the divergence signal is dependable, it could be better.
If you are holding a short due to the divergence and the market starts to back up, but the MACD value rises above the previous MACD extreme, then the divergence is no longer valid.
Once the MACD peaks start rising, the trade must be exited.
Combining divergence with trendlines
One handy tactic is to combine trendlines with a divergence.
When using a trendline to open a position, watch for the completion of both bearish and bullish divergence patterns.
If you hold a long position and a divergence forms, sell and monitor the trendlines closely to see if the price breaks it.
Distance between MA and signal line (overbought/oversold)
Since the moving average convergence divergence indicator is unlimited, it can be successfully used as an overbought/oversold tool.
Let's see exactly how this works:
To determine when the market has entered an overbought/oversold area, monitor the indicator for a sizable distance between the fast MACD line and signal line. The simplest way to see this divergence is by comparing the histogram heights.
This type of divergence frequently results in strong rallies counter to the dominant trend.
Trading the MACD "turn"
The histogram is a very responsive measure of price velocity.
And here's the exciting thing.
It is very effective in trading the MACD "turn."
The moving average convergence divergence "turn" essentially triggers entries and exits based on the MACD histogram instead of the price itself.
Here's how it goes:
-
A bearish signal is triggered when the MACD histogram creates a lower high, indicating that the momentum is subsiding.
-
A bullish signal is triggered when the MACD histogram prints a higher low, signaling an increase in momentum.
Using a bullish signal as an example, we would take a long position once the MACD histogram creates a higher low on one of its bars.
Often the market will continue to decline just as the histogram creates even higher lows.
At this point, an inexperienced trader might panic and make a critical mistake stopping themselves out, frequently just at absolute price lows.
Adhering to the logic of the setup is one of the critical principles of trading with indicators.
What it means is this.
If the position was triggered due to an indicator signal, then the rule set for stop and exit must be based on the indicator.
Using the MACD turns as an example, the trade would be exited if the indicator's value created a new swing low.
In the case of a MACD turn, we would be trading the indicator values instead of the price.
Many beginners would initiate a position based on an indicator's signal. Still, exit at some prearranged price, which falls short of the logic, just like comparing apples vs. oranges, and will frequently fail.
It shouldn't come as a surprise, then, that quite a few traders who experiment with indicators would prematurely give up in frustration and profess that technical trading "does not work."
This is correct because any misapplied tools will fail at their intended purpose.
MACD line peaks and troughs
The features of the histogram itself can be used for divergence analysis.
Additional helpful information can be gained from monitoring and comparing the MACD peaks and troughs with the price line in a divergence analysis.
Because the peaks and troughs in the histogram are sensitive to directional price change over short periods, they can also be used to indicate faster price trend changes within the slower trend.
Summary
The histogram reacts faster to changes in price direction, while MACD itself lags a bit.
Therefore, if you wish to jump on any potential new trend ASAP, use the histogram.
Think of MACD as a trend-following approach – with all its strengths and weaknesses.
Don't anticipate the most straightforward and obvious techniques to achieve great results.
Instead, try to combine the simple MACD crossover system with another idea.
For example, waiting for the first correction after a new trend has been identified using MACD and then entering.
Or find ways to define a sideways-moving market and avoid taking MACD signals under those conditions.
How to make the most out of the MACD trading strategy
Confused by the tones of the trading strategies flooded the Internet? Are you tired of believing another 'trading guru' about the next 'most profitable trading strategy ever'?
We have backtested popular trading strategies, so you wouldn't have to! Save your time and enjoy the reading!
We'd love to start with the indicator that gained the love and respect of millions of traders – the MACD Indicator.
However, can a tool indicate the trend better than the Simple Moving Average? We believe that not.
Together they should identify the trend (MA's part of the job) and then specify the trade entry moment (now it is where we use the MACD).
Sounds easy and profitable at the same time. Let us check whether it is so.
A Couple of Words About Indicators
The MACD indicator is used to check the strength of the trend, the possible direction, and the possible reversal points.
Sounds great to have this one tool for so many options.
The default settings of this indicator are 12, 26, and 9, and we use such.
In the section "Further adjustments," we will mention what other settings you can use for the advanced variations of trading strategies.
Many traders adore MACD and thus a broadly-used indicator for its simplicity and clear signals of the trade's entry points.
As mentioned above, we will also use the 200-bar MA to confirm the trend's direction.
Technical Information
Indicators: MACD (with default settings 12, 26, 9); 200 Moving Average.
Timeframe: 1h.
Currency pair: Any, but we take EURUSD as an example.
Stop Loss/Take Profit: 10/20 pips each.
200 Moving Average usually is used to confirm the direction of the trend:
- If the price line is placed over the 200 MA, then the uptrend is spotted, and vice versa – the price line under the 200 MA signals the downtrend.
Please, note: if the price is over the 200 SMA – we are looking for the BUY signals only; if the price is below the 200 SMA – we search for the SELL signals only.
At the same time, the MACD indicator clearly shows the entry points of the trades.
Despite the nature of a lagging indicator, the MACD crossover strategy is widely used in Forex trading.
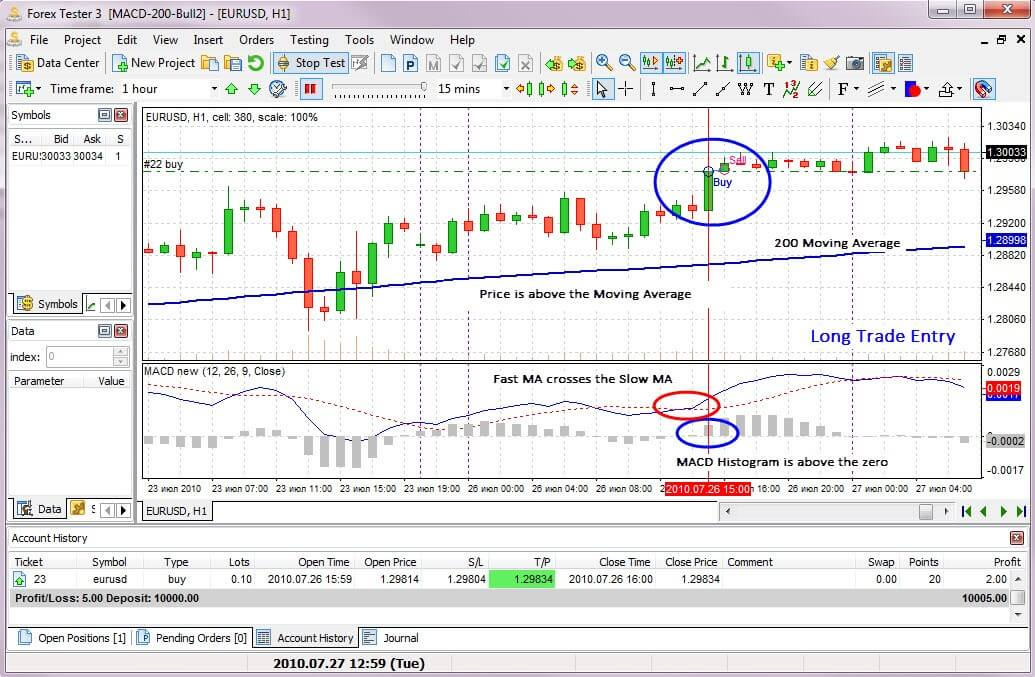
Long trade entry rules
The price line is above the 200 Moving Average, pointing to the uptrend.
The Fast Moving Average of MACD makes a cross upward with the Slow MA.
Check the MACD histogram slopes for the confirmation of the lasting uptrend – the slopes of the histogram should cross the zero line above.
When all the conditions are met, we spot buy and sell signals enter the trade.*
*Please, note that we use the cross of the MACD Moving Averages and the reverse of the MACD's histogram slopes as the entry point.
However, as mentioned in the Adjustments settings, this issue can also be a matter of change.
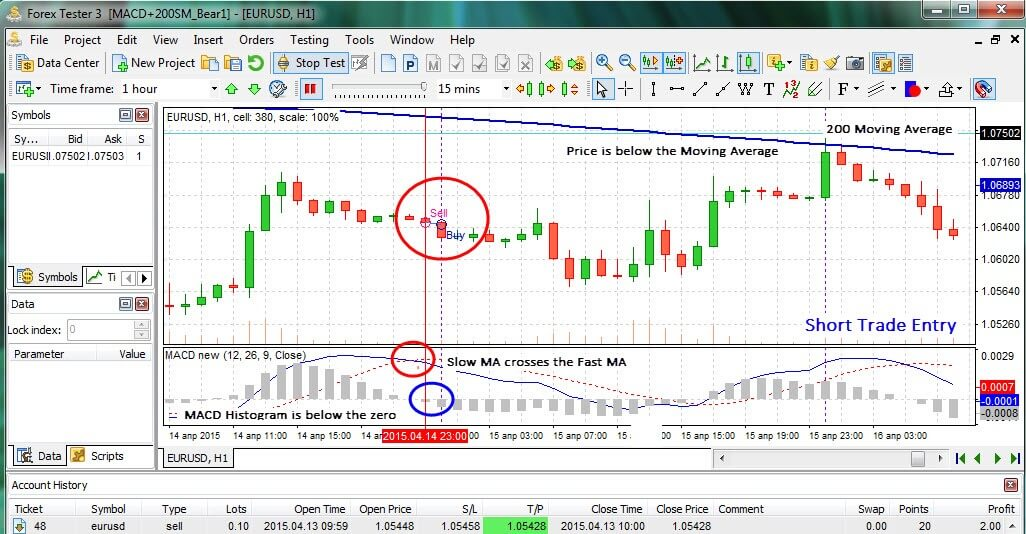
Short trade entry rules
The price line lies under the 200 moving average indicating the downtrend.
The Fast Moving Average of MACD makes a cross downward with the Slow MA.
Check the MACD histogram slopes to confirm the lasting uptrend – the histogram's slopes should cross the zero level from above.
When all the conditions are met, we enter the short trade.
MACD Crossover Strategy Backtesting Results
Market Training set Forward testing
Bull 90 pips 30 pips
Bear 160 pips 80 pips
Flat -40 pips 70 pips
Trades|Period*
Market Training set Forward testing
Bull 01/03/2011 - 10/06/2011 09/06/2010 - 12/07/2010
Bear 01/01/15 - 14/04/2015 01/09/2014 - 13/10/2014
Flat 01/09/2016 - 09/12/2016 04/05/2015 - 08/06/2015
*How long it took us to enter the 50 trades for the Training Set and 20 trades for the Forward Testing?
A Reminder: to save your valuable time and efforts, we have introduced the system of backtesting when you perform only 50 trades through 3 different types of market (Bullish trend, Bearish trend, and Flat markets) and then again 20 trades through the given types of market, but during other periods.
Then with simple math calculations, we can make conclusions about the effectiveness or irrelevance of the MACD trading strategy.
The full version of the theory of our backtesting experiments and how we came up with the idea of such backtesting can be read here.
Conclusions
It is clear that this strategy, based on the given settings, cannot give the wanted results; although it is not a total loss, a professional trader probably won't be satisfied by the gained profits.
These indicators require volatile markets to show their best (as you can see, the worst performance was during the Flat markets).
Although we have received positive results through the Bear markets, for example, can such results satisfy any trader – 160 pips in more than three months?
The entry rules of the strategy are too selective, and we need to catch up on some trade setups to get more accurate MACD signals.
Again, we received such results by backtesting at the given timeframe, with the mentioned Stop Loss and Take Profit, and entered the trades based on the trading signals we defined as proper.
Are there any better ways to apply the MACD strategy? We bet there is, but only by adapting the settings to your needs and the needs of your strategy.
It does not mean the MACD strategy itself is not profitable; the aim of our experiment wasn't to give the ready advice you should mindlessly believe in.
But to show that even the slight details of any trading strategy should be carefully backtested before being used during live trading.
Further Adjustments for Better Results
What particularly can be a matter of the additional change and backtesting?
As mentioned, we use the MACD indicator with the default settings.
However, there are dozens of theories that, for some purposes, the custom settings might work the best.
Stop loss and take profit – one of the ways to utilize the Parabolic SAR is to use the dots as the marks to place the trailing stop.
Besides, you can try different ratios of the TP and SL or close the trades manually when the Parabolic SAR's dots show the reversal signal.
Timeframe and the currency pair – try the MACD strategy for scalping or day trading;
You can try the MACD indicator alone or accompanied by other indicators.
Try what combo can work the best for you – Stochastic or RSI, Awesome Oscillator, or Parabolic SAR.
Please, take into account that our floating spread is set to 1.
Remember that the size of the spread matters, and the larger it is, the bigger should be the profits to cover it up.
As you can see, adjusting, testing, and changing accordingly – is the only way to find the options suitable for you.
There are dozens of ways to trade the indicator alone or in combination with others.
We show only one way to trade. However, nothing should stop curious minds from trying different settings and checking how they can influence the final results.
Try It Yourself
Backtesting is quite a simple activity if you have the right backtesting tools.
This strategy was tested in Forex Tester with the historical data that comes along with the program.
You can download Forex Tester for free to check this (or any other) strategy's performance.
In addition, you will receive 22 years of free historical data (easily downloadable from the software).